

HEET Maps Offer Emissions Data
HEET has updated the gas leak maps—and this year you can see the estimated emissions for each town.
The maps now show 2020 data for each city and town with gas service. The new emissions calculator page explains how we calculated the emissions for each town. You can enter your own data to see what happens.
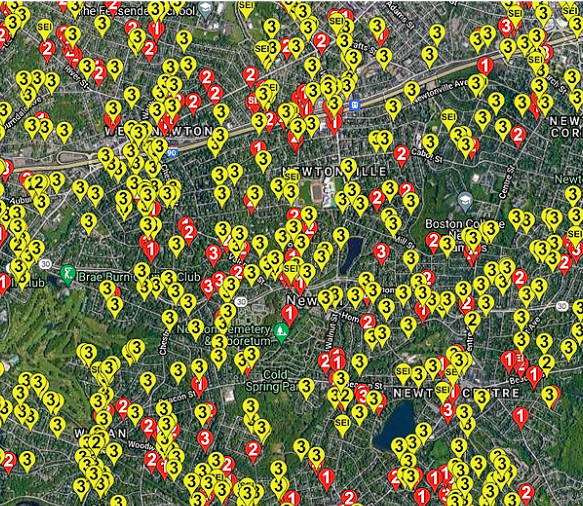
We’ve also increased map clarity by adding leak grades and significant environmental impact leak (SEI) information.
Our gas leaks data is geocoded, cleaned and shared through HEET’s library. These data were recently used by Salem to tell its own story of gas leaks in its 2019 Salem Natural Gas Leak Report.
Maps can be used to integrate with urban tree inventories, public works project coordination, and wherever your town needs the data. Contact us if you want to collaborate.